In September I celebrated 5 years in the industry (and 5 years closer to retirement)!
I played with the idea of writing a post with some of the lessons/tips about Data Science on the job I learned along the way. In the meantime I made a proposal for a Lighntening talk for NormConf about this very topic with the title “random.randint(5, 12) lessons I learned as a Data Scientist in 5 years in industry”. You can checkout the video of my performance, together with a bunch of really interesting talks, here.
Since I am not Eminem in my 5 minutes talk I could not fit all the lessons. So here it’s the complete list😊
Don’t take acronyms for granted
If you come from a statistics background you are used to RMSE (Root Mean Squared Error), MAE (Median Absolute Error), PCA (Principal Component Analysis), SVM (Support Vector Machine), RNN (Recurrent Neural Network), NLP (Natural Language Processing).
People in your company could use acronyms such as POC (Proof Of Concept), PLC (Programmable Logic Controller), MVP (Minimal Viable Product), CRM (Customer Relationship Management), BOM (Bill Of Materials), ROI (Return On Investment) and WTF.
If someone uses one you don’t know, just ask straight away what it means, it would make everything easier.
On the other hand when talking with a not tech person in the company do not take for granted they know your acronyms. Just make them explicit.
Learn to craft presentations

Sooner or later you will have to present the result of your work. It could be in a company meeting or a conference.
Some tips I find useful:
- Tailor on the audience: if your audience is some big boss leave out the technical details, if you are presenting to a tech audience they will probably be very interested in those.
- Avoid slides full of text: unless you want people to start scrolling at their feeds having many lines of text is not a great strategy. Walls of text are the worst of the worst. Many lines, smaller character size, less readability.
- Self contained plots: that’s an advice in itself, but it is especially important in presentations. A plot in your slides should have title, labels and information to be clear even if you were not to describe it.
- Fit in the time given: for scheduling reason you will have a time constraint. No one will complain if you take a couple minutes more but please don’t be the speaker that has to skip part of the presentation or steals the time from other people (or from the coffee break).
Do what is needed
When I got hired I expected to work full-time on analysis using R or Python. But often the analytical/modeling part is just one small part of the job.
In my case daily activities include: talking with the experts to understand what we needed to solve, retrieving and transforming the data, actually building the model, wrapping it around a Flask app, dockerizing and deploying.
And other times doing what is needed means not using data science when a more traditional approach would make it.
Data don’t live in tidy files
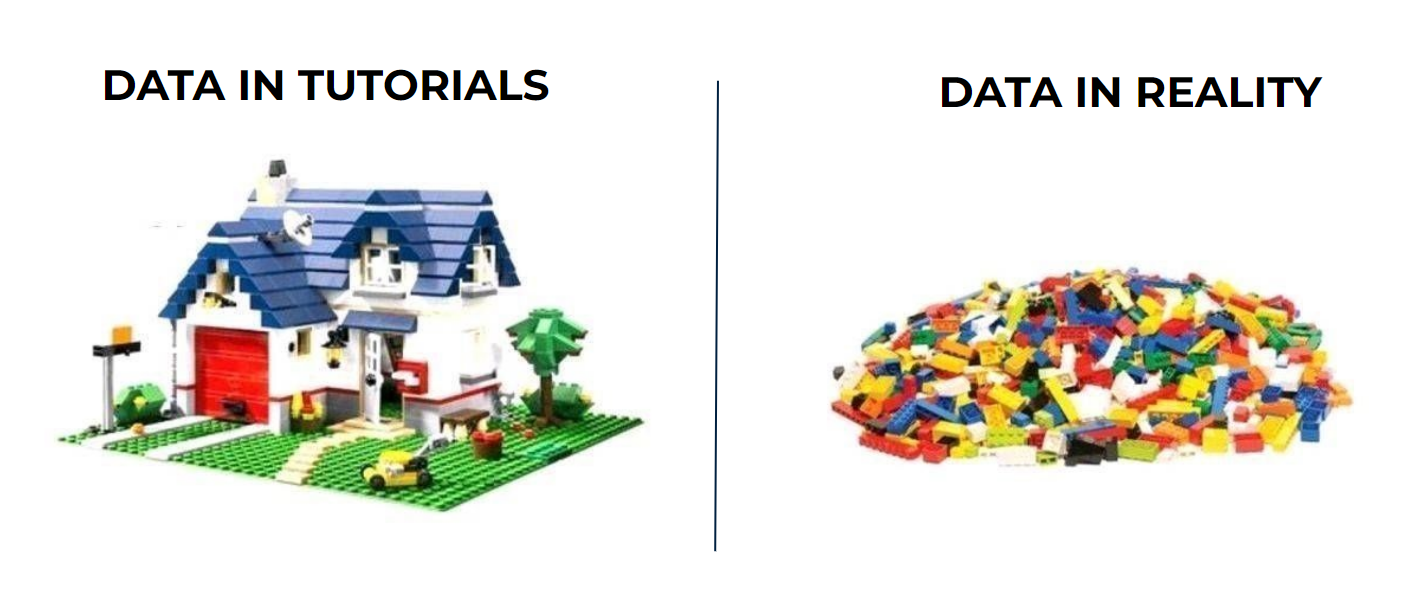
Gone are days in which you were provided with a tidy dataset in Excel or with fakely missing data (I am looking at you Titanic’s dataset). Most of the days you will have to build your own dataset.
Some examples:
- get it from a bunch of JsonLines (thank you pandas.read_json(path, lines=True))
- extract tables from PDFs (thank you Camelot)
- take a week to label images because you are the intern
Prefer easy models

Neural networks are cool and you want to use bleeding edge tech for sure. But you should prefer easy models.
Often they are good enough for your goal and anyway give you a baseline on which to improve with more complex algorithms.
Some of these models such as linear regression are also easier to explain to stakeholders.
Document

“No need to write this down” it may be the most used sentence right before forgetting the thing. Even if you have a good memory, writing how you solved an issue or an important concept it is a great investment. Some months later you will thank yourself for documenting how to run a docker image interactively exposing the right ports.
Depending on the medium you choose other people could benefit: your future self, your team mate, a stranger who stumbles on your blog post.
Understand what stakeholders really want

Focus on the needs of the stakeholders, even the untold ones. Maybe you are looking forward to applying some machine learning model but it can be the case that it is much more useful making graphs or computing some statistics. Often the important part is to talk with the shareholders and discover together what they really need rather than follow blindly their request of “applying AI on this data”.
Automate the repetitive stuff
Inspired by the “Automate the boring stuff with Python” but with two small twists. It has not to be boring, it’s enough that you find yourself doing the same thing again and again. You can use whatever language and tool makes the job done. Of course the time to automate the task must not be superior to the time saved over the long term.
Use Notebooks Moderately

Jupyter notebooks are a nice tool for exploratory data analysis, quickly experiment and model the data, and if you need to generate a report. But when it comes to code for model deployment or that you want to reuse in other projects it is way better to use scripts. Don’t take my word for it, you can watch what Joel Grus thinks about them. (For sure some steps to mitigate versioning have been implemented).
Make interpretable graphs

When you make a plot you can never know where it well end up. You should make it easy to read even if you are not there to describe it.
The checklist that I try to follow comprehends:
- title (and optionally subtitle) so that is clear to everyone what the graph is about
- legend if multiple color are present, no one should guess what each line is
- axis labels even if the x-axis is time or the y-axis is frequency
- unit of measures that are particularly useful when plotting physical measures
Name variables
Borrowing some wisdom from (supposedly) Phil Karlton:
There are only two hard things in Computer Science: cache invalidation and naming things.
I cannot help you on how to cope with cache invalidation, here are my 2 cents on naming things:
- don’t use abbreviations unless they are widely known
- i and j are a bad choice also in a for loop
- if there is a convention, follow it (variable cases, use of plurals…)
Learn Git
In 2017 was a nice to have, today it is really really nice to have. As most of the things you can pick up the basics in some hours, and spend years to master it. Don’t worry you will learn along the way.
Some recommendations:
- use UI tool if you like, but try to get what is going on under the hood
- wait some time before using rebase
- avoid force pushing
You can find my git cheat sheet where I saved some of the git commands that I found myself google more/interesting. For a detailed guide when things go south check Oh Shit, Git!?!.
Learn to use the command line
No one expects a data scientist to be a wizard at the terminal but being able to use it will make your life easier in many situation without having to write custom code. Start with ls, cat, head, tail, wc, grep and sed (probably better to go with awk directly). If you want a resource tailored on data science check out this free book.
Domain Knowledge is essential

It’s virtually impossible to build a useful model just invoking sklearn on the data (unless you have to predict iris species). You need a ton of domain knowledge.
There are two options:
- You are the expert! That is the likely option if you pick up statistics and programming along the way to solve a problem or if the service/product your company sells is strictly related to tech.
- Work closely with an expert. In this case you can learn under his direction and in the meanwhile share what you know. Double win!